Source cut-off: 16 November 2026, 14:20 IST
What happened
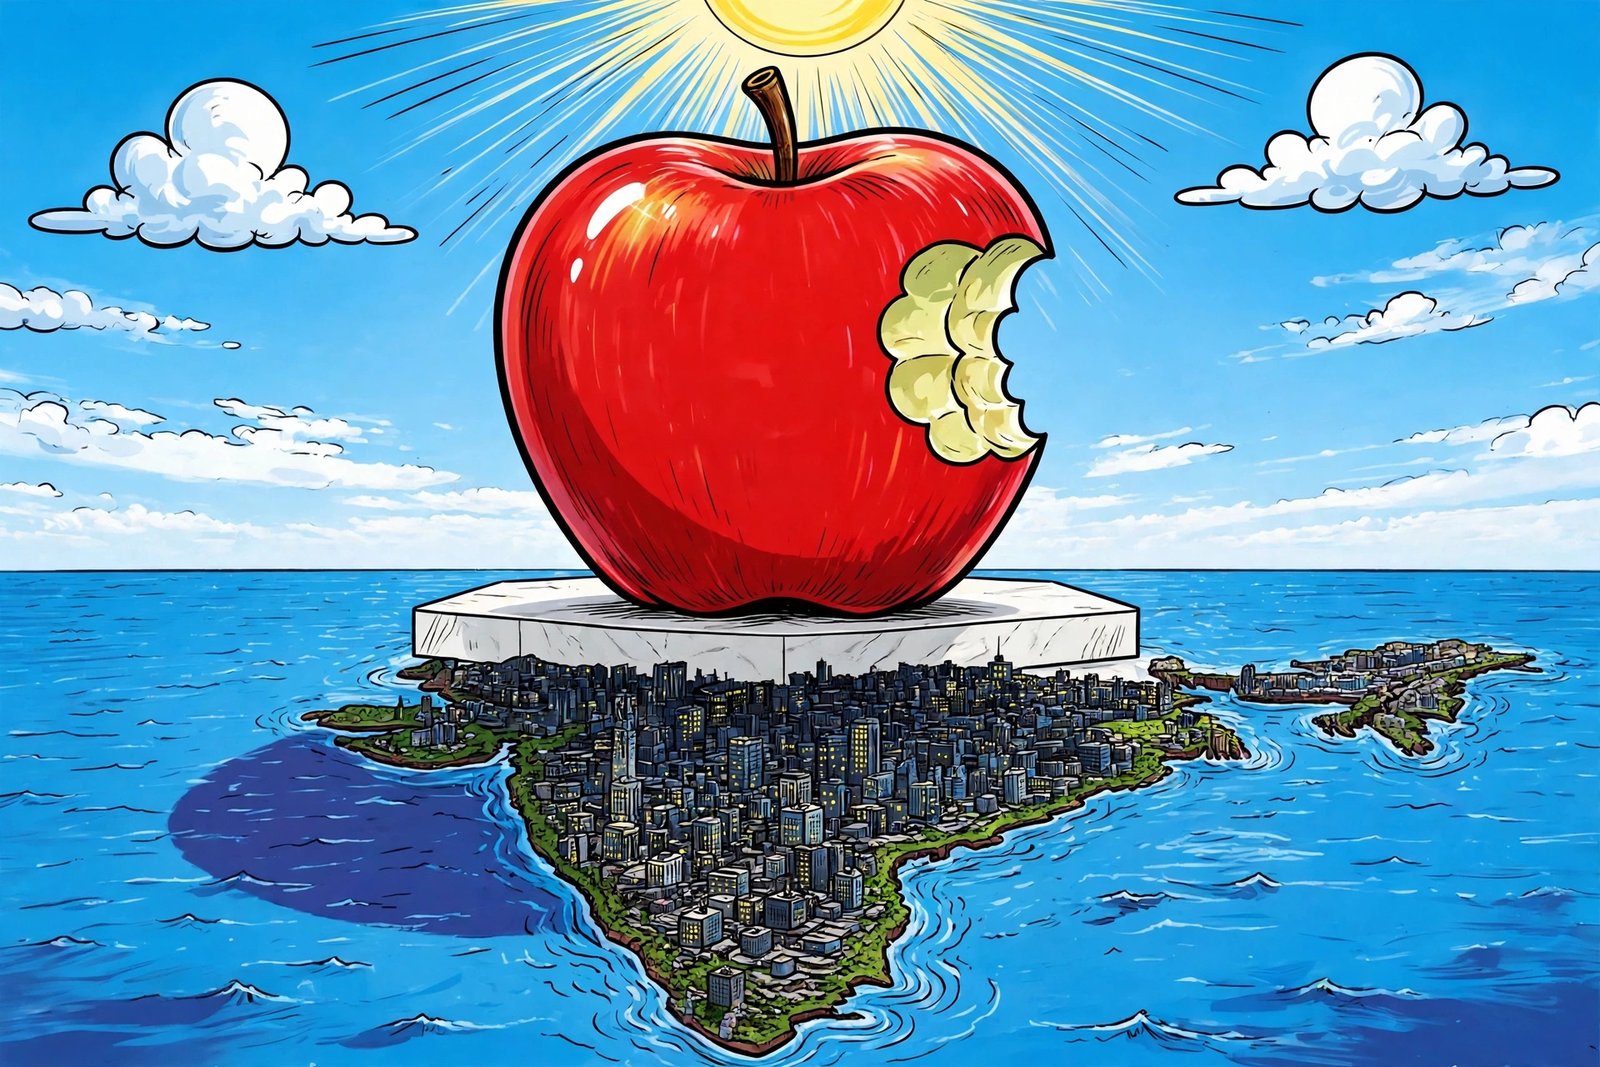
At the close on Friday 13 November 2026, one company and one country's entire listed market stood at almost the same value. Apple closed at $356.27. Multiplied by the 14,532,182,000 shares outstanding recorded on the cover of its annual report filing for the fiscal year ended 26 September 2026, that price gives a market capitalisation of about $5.18 trillion. Every company listed on the Bombay Stock Exchange together came to Rs 510.17 lakh crore at the same close, which converts to about $5.42 trillion at the Reserve Bank of India's reference rate of Rs 94.1997 per US dollar. The ratio of the two is 0.96: India's combined total is the larger, by about 4.6 percent. The National Stock Exchange's total, Rs 508.27 lakh crore a session earlier on 12 November 2026, gives the same ratio.
The comparison prompts an obvious question, and it is the question this brief was commissioned to answer: does a single company, Apple, generate more value than all of India's listed companies combined, Reliance Industries, State Bank of India and the rest? The short answer is that market capitalisation cannot settle that question, because it does not measure what a company generates. It measures something else, precisely, and the rest of this brief separates the two.
Why it matters
Market capitalisation is a multiplication, not a measurement of output. It takes the last traded price of one share and multiplies it by the number of shares in existence. The result is the market's price for the whole of a company's equity at a moment in time: what a buyer would notionally pay for every share at the price the last trade set.
A share price alone carries even less information. A company can halve its share price by splitting each share into two, doubling the count, and nothing about the company has changed. A price per share becomes meaningful only when the count is known, which is why market capitalisation exists as the standard measure of equity size.
What the multiplication prices is the future, not the present. Apple's market capitalisation of about $5.18 trillion stands against total shareholders' equity of $112.1 billion in its own balance sheet, a ratio of about 46 times. Shareholders' equity is the book value of what owners have contributed and retained over the company's life. A price at about 46 times that figure is not a price for the assets already in place; it is the market's present assessment of earnings the company has yet to report.
The figure also counts shares that cannot be bought. Market capitalisation values every share at the last traded price, including holdings that are not offered for sale. Reliance Industries, India's largest listed company, has a free-float market capitalisation of Rs 8,93,333.19 crore, about 49 percent of its total; the free float is the part of a company held by public investors and available to trade. The headline total prices the whole register at the marginal trade's price.
And the figure moves on its own. India's combined market value rose by about $640 billion between late October and 12 November 2026, across a span in which no annual results were reported and no company's factories, branches or software changed. Prices moved; production did not.
Past performance may or may not be sustained in future.
None of this makes market capitalisation useless. It makes it specific. It answers one question: what does the market currently charge for this equity, in total? It does not answer what a company earns, sells, employs, owes or returns. Those questions have their own measures, and on those measures the comparison between one company and a country's listed sector looks different in both directions.
What changed
Nothing about Apple, and nothing about India's listed companies, changed between the section above and the ones below. What changes is the measure. Run the same comparison on what companies produce, hold, owe and return, and the near-equality of the headline dissolves: on some measures the single company is startlingly large, on others the country's sector is far larger than one company, and on one measure the comparison cannot be run at all.
Profit. Net profit is what remains of a year's revenue after every cost, interest charge and tax has been paid: the bottom line of the accounts. Apple's net income for its fiscal year ended 26 September 2026 was $132.2 billion. For India, no exchange publishes a combined profit figure for every listed company; the broadest published aggregate is a sample of 1,495 listed companies, which reported combined net profit of Rs 19.71 lakh crore, about $209 billion, for the fiscal year ended 31 March 2026. The sample is not the whole market: 4,717 companies are listed on the two main boards, and the several thousand outside the sample are mostly small. Labelled for what it is, the comparison is still striking: Apple's profit alone comes to about 63 percent of the combined profit of those 1,495 companies.
Revenue, where it can be counted. Revenue is the value of what a company sold in the year, before costs. Apple's net sales were $478.8 billion, of which the iPhone alone accounted for $254.1 billion. For listed India as a whole, no combined revenue figure is published by either exchange, and none exists in the broadest compilation the desk found: on revenue, the one-company-against-a-country comparison cannot be run, and any version of it in circulation rests on an estimate. The comparison can be run company to company. Reliance Industries reported revenue (value of sales and services, the headline line of its annual report) of Rs 11,75,919 crore for the fiscal year ended 31 March 2026, about 26 percent of Apple's revenue. Its profit attributable to owners, the basis comparable to Apple's net income, was Rs 80,775 crore, about 6.5 percent of Apple's profit. Its group workforce was 4,19,911 people, about 2.5 times Apple's about 167,000 full-time equivalent employees. Its market capitalisation is 3.7 percent of Apple's. Divided by the people employed, market value comes to about $31.0 million per employee at Apple and about Rs 4.32 crore (about $458,000) per employee at Reliance: one measure, price, divided by a count of people, and the distance between the two readings is a measure of how differently the two organisations produce, stated without grading either.
Cash. Operating cash flow is the cash a business generates from its operations in a year, before it spends on new capacity; free cash flow is what remains after that spending. Apple's operating cash flow was $145.1 billion, and its free cash flow was $136.1 billion. No equivalent combined flow is published for listed India. What the sample publishes is a stock, not a flow: the 1,495 companies held combined cash and bank balances of about Rs 18 lakh crore at the end of the fiscal year. A stock of cash sitting on balance sheets and a flow of cash through a year are different kinds of number, and the desk does not set one against the other.
Cash returned to shareholders. A dividend is cash paid out of profit to shareholders; a buyback is the company purchasing its own shares, returning cash to the shareholders who sell and concentrating the holdings of those who remain. In its fiscal year Apple paid $15.7 billion in dividends and spent $86.4 billion repurchasing its shares: $102.1 billion returned in total. The 1,495-company sample paid Rs 4.86 lakh crore in dividends, about $51.6 billion, and spent Rs 19,378 crore, about $2.1 billion, on buybacks: about $53.7 billion in total. One company returned about 1.9 times the cash that 1,495 companies returned together, and its buybacks alone were more than forty times the sample's buybacks.
The price of profit. The price-to-earnings ratio divides a share price by the earnings per share behind it, and states how many years of the latest reported profit the price represents. At the 13 November close, Apple's price stood at 39.7 times its fiscal 2026 diluted earnings per share of $8.98. The Nifty 50 index, on the National Stock Exchange's published valuation for the same close, stood at 20.49 times. A computed approximation for the whole Indian market, total market capitalisation divided by the sample's combined profit, gives 25.9 times; the numerator covers the whole market and the denominator only the sample, so the figure is an approximation and is labelled as one. The desk records these multiples without grading them. A multiple is a record of what buyers currently pay for a unit of current profit, with their expectations of future profit carried inside it. It is not a finding that either price is right or wrong.
Balance sheets, and banks in particular. Market capitalisation prices equity only. Everything a company owes sits outside it, which matters most for banks, whose business is borrowing and lending. A bank's deposits are money customers have placed with it, a liability the bank must repay; its advances are the loans it has made, assets funded largely by those deposits. State Bank of India, at 30 September 2026, held deposits of Rs 62,77,919 crore and gross advances of Rs 52,08,344 crore. Against its market capitalisation of Rs 9,97,368 crore, deposits alone are 6.3 times the market's price for the bank's equity, and deposits and advances together, Rs 1,14,86,263 crore, are 11.5 times. A bank's balance sheet is structurally many times its equity value; a market capitalisation comparison between a bank and a technology company compares the equity slices of two very different structures.
Tax paid. Cash tax paid is the tax a company actually hands over in a year, as distinct from the tax charge in its accounts. Apple paid $34.59 billion in cash income taxes across all the countries it operates in during its fiscal year. India's gross direct tax collections for the fiscal year ended 31 March 2026 were Rs 28.12 lakh crore, of which gross corporation tax was Rs 13.81 lakh crore. Apple's cash tax equals about 11.6 percent of the country's entire direct tax collections and about 23.6 percent of its corporation tax collections. The comparison measures scale and nothing else: one side is a single company's worldwide payments, the other is a country's collections from every company and individual in it.
What has not changed
Market capitalisation remains the right answer to the questions it actually addresses. It is the standard measure of equity size at a date, and size has mechanical consequences: index membership and weight follow it. Apple carried a weight of 7.70 percent in the S&P 500 on the index factsheet dated 31 October 2026, the largest constituent weight on that date. Set against an economy, the same total gives the market-capitalisation-to-GDP ratio: India's Rs 510.17 lakh crore against nominal GDP of Rs 346.36 lakh crore for the fiscal year ended 31 March 2026 (provisional estimates) is 147 percent. The numerator is a value on one November day and the denominator a flow across a fiscal year; the pairing is the standard form of the ratio, and its mixed dating is stated rather than hidden.
India's market is also broader than the headline comparison suggests. The near-equality is between one company and a total spread across 4,717 listed companies; India's ten largest companies combined account for 20.5 percent of that total, and for 21.4 percent of Apple. A Bloomberg country table dated 12 November 2026 ranks India fifth among the world's equity markets, and against a world total of $169.76 trillion in a compilation of World Federation of Exchanges data, India's share is about 3.2 percent, a figure the desk treats as approximate because the world total rests on a compilation rather than the federation's own published statistics.
What has not changed, finally, are the limits. A market capitalisation is a price, struck on one day and converted at one exchange rate: every dollar figure in this brief moves if the rupee rate of Rs 94.1997 moves. It is silent on revenue, profit, cash, debt and people, not because it is a bad measure, but because it is a narrow one. The error is never in the number. The error is in asking it a question it does not answer.
What we are watching
There is no calendar of events behind this brief, and it freezes no expectations. It closes instead with the questions that complete the picture whenever a market capitalisation or a share price is quoted, for a single company or for a whole market. They are educational questions, answered from the standard contents of published accounts, and they are the same questions the sections above applied.
What does it earn? Profit after every cost and tax, the bottom line, set against the price being quoted for the company.
What cash does it generate? Operating cash flow, and what remains of it after the spending that keeps the business running. Profit is an accounting result; cash is what arrived.
What does it owe? The balance sheet: the borrowings and other liabilities that stand between a company's assets and the equity slice that a market capitalisation prices. For a bank, the deposits and advances that dwarf the equity.
What does it return? Dividends paid and shares repurchased: the cash that actually reached shareholders in the year, set against the cash the accounts say was earned.
What does the price assume? The multiple: how many years of current profit the price represents, and therefore how much of the price rests on profits that have not yet been reported.
A market capitalisation answers none of these. It was never built to. Read alongside them, it takes its proper place: one number among several, and not the one that measures what a company generates.
Sources: Apple Inc., Form 10-K for the fiscal year ended 26 September 2026, filed 3 November 2026; Apple Inc., consolidated financial statements for fiscal Q4 2026 (released 2 November 2026); Nasdaq market data via Finnhub, AAPL daily prices, 13 November 2026; Bombay Stock Exchange total market capitalisation as reported by Moneycontrol, 13 November 2026; Reserve Bank of India, reference rate, 13 November 2026; National Stock Exchange, quote page for Reliance Industries and daily index valuation as compiled, 13 November 2026; Reliance Industries Limited, Integrated Annual Report 2025-26; State Bank of India, analyst presentation for the quarter and half year ended 30 September 2026, filed 3 November 2026; Business Standard, analysis of listed-company results and payouts, fiscal 2025-26; Ministry of Statistics and Programme Implementation, Provisional Estimates of Annual GDP for 2025-26, released 5 June 2026; Central Board of Direct Taxes, collections release, fiscal 2025-26; Bloomberg country market capitalisation table as reported by Business Today, 12 November 2026.